Please wait while the Adult mouse prostate dataset is loading...
This should take < 1 minute
Welcome!
Use this app to browse scRNA-seq data from adult
intact/hormone naive
and
regressed/castrated
mouse prostate epithelial cells.
The
HiResClusters
group was included in the app, for additional subclusters.
Genes with very low expression levels have been excluded from this app to optimise speed.
Raw data can be found at:
GSE151944
[samples: GSM4594199, GSM4594200, GSM4594201]
Browse scRNA-seq from mouse
embryonic prostate explant cultureshere!
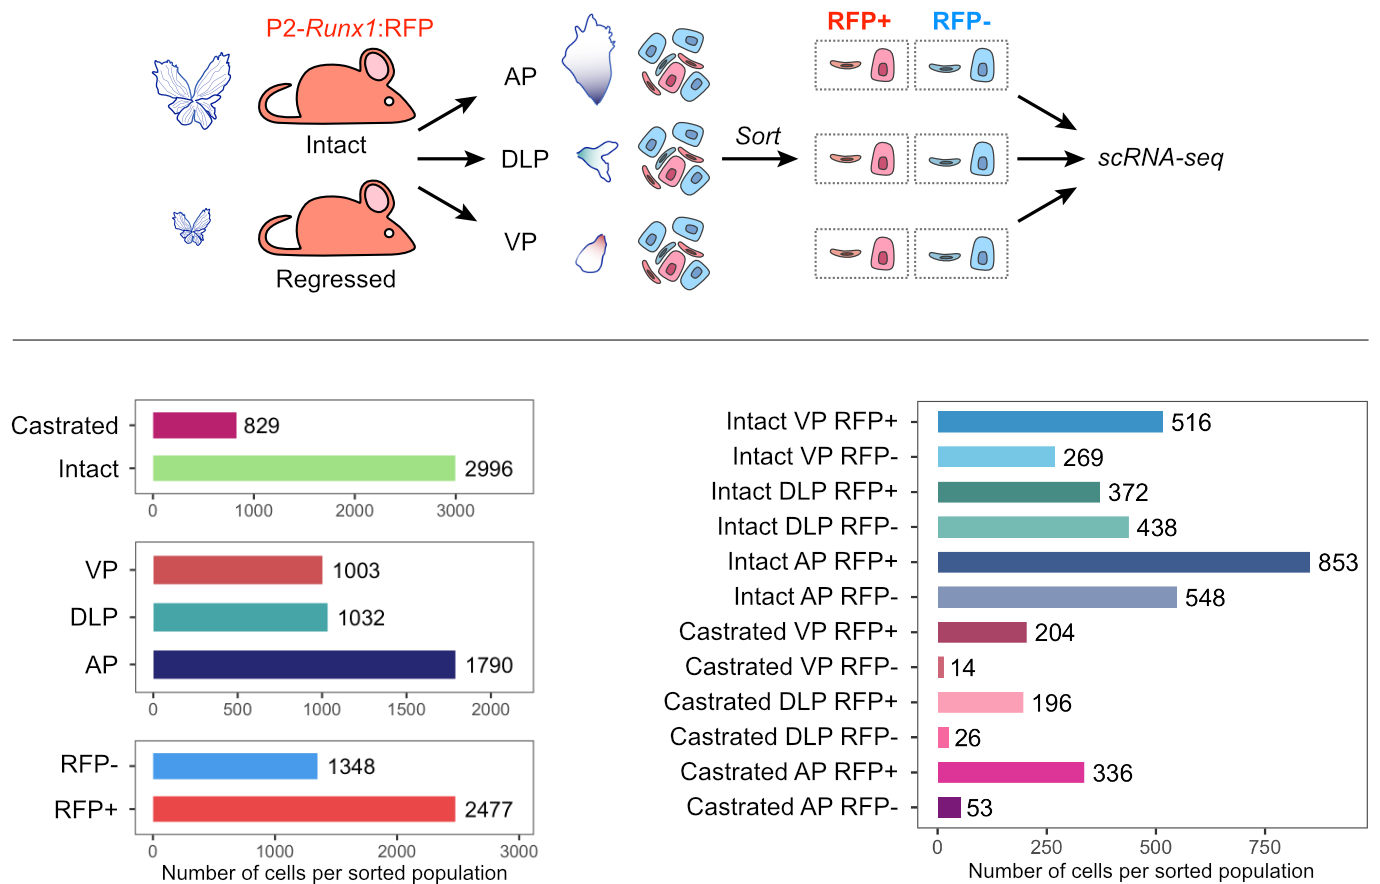
Experimental design
To characterise the heterogeneity of RUNX1+ and RUNX1- fractions of the mouse prostate, we performed droplet-based scRNA-seq on the 10x genomics platform.
We dissected individual lobes of intact/hormone naive and regressed/castrated mouse prostates, isolated from P2-Runx1:RFP reporter mice, expressing RFP as a surrogate of
Runx1
expression.
In order to compensate for the relative sparsity of RFP+ and RFP- cells respectively pre- and post-castration, we enriched for under-represented populations by FACS prior cell encapsulation.
Individually sorted populations from each lobe were multiplexed using MULTI-seq lipid-tagged indices in order to minimize technical confounders such as multiplets and batch effects
(McGinnis et al., 2019)
Citation
Mevel R., Steiner I., Mason S., Galbraith L., Patel R., Fadlullah MZH., Ahmad I., Leung HY, Oliveira P., Blyth K., Baena E., Lacaud G., (2020)
RUNX1 marks a luminal castration resistant lineage established at the onset of prostate development.bioRxiv
2020.06.19.161604; doi:
https://doi.org/10.1101/2020.06.19.161604.
You can exclude specific populations from the differential expression using the following filters.
Note that by default, all populations are kept.
Additional notes
- If
Group 2
is left blank, Group 1 will be compared to all the other cells.
- Results are displayed in the
Results Table
tab.
- Calculation usually takes < 2 minutes.
- We use
MAST
for differential expression testing, implemented in Seurat's
findMarker()
function.
- Genes not detected in at least 25% of either of the two groups are removed.- Genes showing less than 25% difference in the fraction of detection between the two groups are excluded.
Results legend:
avg_logFC: log fold-chage of the average expression
between the two groups. Positive values indicate that
the gene is more highly expressed in the first group.pct.1: percentage of cells where the gene is detected in the first group.pct.2: percentage of cells where the gene is detected in the second group.p_val_adj: adjusted p-value, based on bonferroni correction, using all genes in the dataset.
Source:
Seurat's documentation